
Data Observability: The One Thing Missing from Your Data Pipeline
Data engineers spend almost 40% of their time chasing down bad data, and data observability exists to fix that. Here's everything you need to know.

You wake up to zero alerts. No failed jobs, no Slack pings, no red dashboards. Good day, right?
Except someone on the sales team just flagged that revenue looks off. Just a little wrong. You dig in, the pipeline ran fine, but the data has been quietly wrong for days. No alarm went off. Because technically, nothing failed.
Sound familiar? This is not a pipeline problem. This is a visibility problem.
Did you know?
In January 2026, Microsoft acquired Osmos, an AI tool that automates data preparation, and built it into Microsoft Fabric. The reason? Data was getting harder to trust, and Microsoft wanted a fix built right into the platform.
So, the world’s biggest software company just made a billion-dollar bet on data trust. Let’s talk about what that means for you.
What is data observability?
Data observability is the ability to fully understand the health of your data at any point in time. It means knowing if your data arrived on time, if the volume looks normal, if the values make sense, and if anything changed in its structure.
In short, it answers one question: “Can I actually trust this data right now?”
The concept borrows from software engineering, where a system is “observable” if you can understand what’s happening inside it just by looking at its outputs.
As data stacks grow more complex, a single bad value at the source can travel all the way to a business dashboard without triggering a single alert. Because technically, nothing failed. That’s the gap data observability is designed to close.
But how is it different from data quality or data testing, terms you have probably heard used interchangeably?
Data quality vs. data testing vs. data observability
These three terms get used interchangeably all the time, but they shouldn’t.
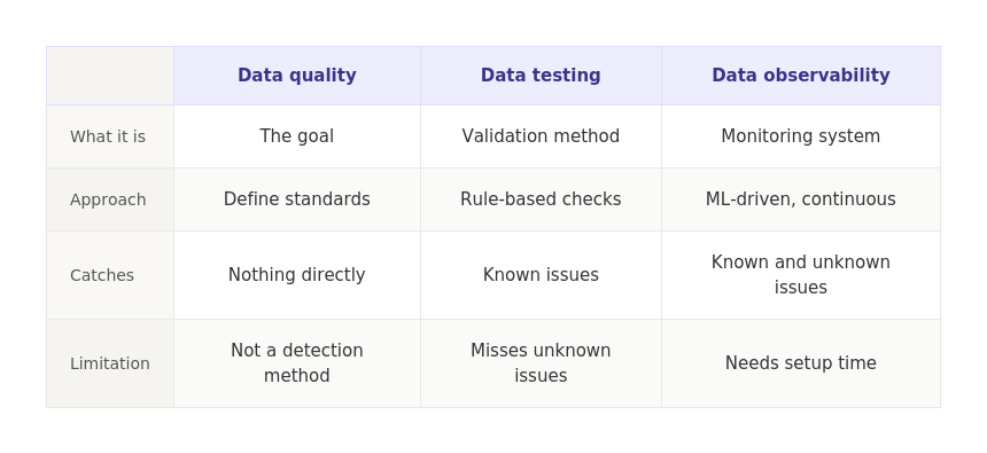
Data quality is the goal. It is the standard your data needs to meet before anyone can trust it for a business decision.
Data testing is how you validate known expectations. You define rules in advance, and your tests check whether those rules hold. It catches problems you already know to look for, but not the ones you didn’t anticipate
Data observability goes further. It continuously monitors your data’s behavior, learns what normal looks like, and flags when something deviates, even if you never wrote a test for it.
A simple way to think about it:
Data quality is the destination. Data testing is a safety net. Data observability is the surveillance system that watches everything in between.
So now that you know the difference, what exactly should you be watching?
The 5 pillars every data engineer should know
Think of these as the five questions you should always be able to answer about your data.
Freshness asks whether your data is up to date. If a table that usually updates every hour hasn’t changed in six, something is off. Stale data is one of the most common and least obvious problems in a pipeline.
Volume tracks whether the amount of data arriving looks normal. A sudden drop in row count often means something broke upstream, even if the pipeline itself shows no errors.
Distribution looks at whether the values in your data make sense. Are there unexpected nulls? Did a numeric column suddenly start returning negative values? Distribution checks catch the kind of quiet corruption that no job failure alert ever would.
Schema monitors the structure of your data. Columns get renamed, data types change, new fields appear without warning. Any of these can silently break downstream models or dashboards.
Lineage maps where your data comes from and where it goes. When something breaks, lineage tells you exactly what is affected and how far the problem has travelled through your stack.
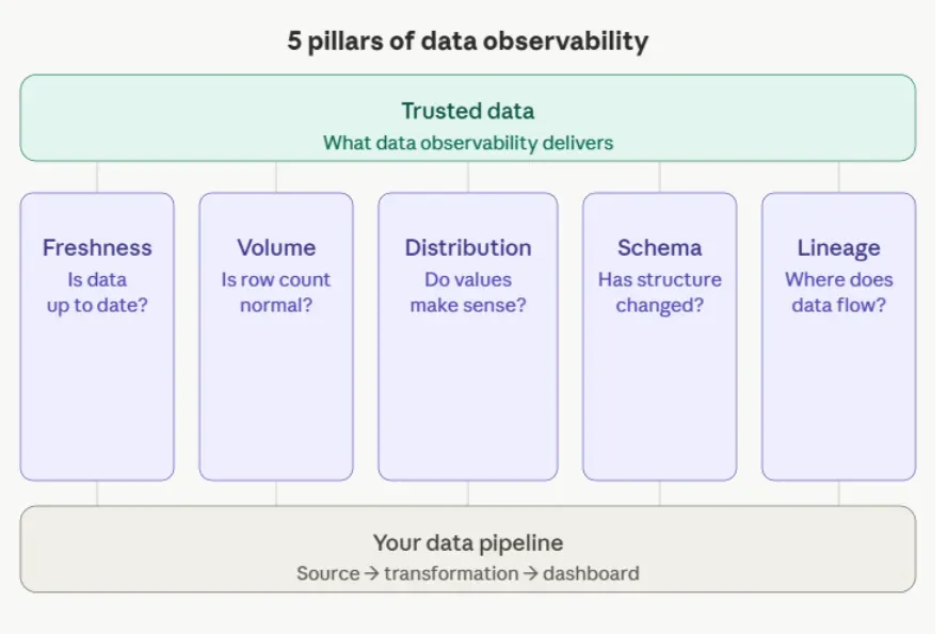
Together, these five pillars give you a complete picture of your data’s health, not just whether it arrived, but whether it can be trusted. Let’s see how to actually implement them.
Implementing these pillars
Let’s say you work at an e-commerce company. Your pipeline pulls order data daily and loads it into a Snowflake table called orders that feeds your sales dashboard. Here is what observing that pipeline looks like across the first three pillars.
Freshness
Your orders table should update every hour. If it hasn’t, something broke upstream. This query checks when it last received data and flags if it’s been more than 60 minutes:
SELECT
  MAX(updated_at) AS last_updated,
  DATEDIFF(’minute’, MAX(updated_at), CURRENT_TIMESTAMP()) AS minutes_since_update
FROM orders
HAVING minutes_since_update > 60;
If this returns a result, your data is stale.
Volume
On a normal day, your orders table receives a fairly consistent number of rows. A sudden drop likely means something broke upstream. This query flags if today’s count is more than 30% below the 7-day average:
WITH daily_counts AS (
  SELECT
    DATE(created_at) AS date,
    COUNT(*) AS row_count
  FROM orders
  GROUP BY 1
),
avg_count AS (
  SELECT AVG(row_count) AS avg_7d
  FROM daily_counts
  WHERE date >= DATEADD(’day’, -7, CURRENT_DATE())
)
SELECT
  row_count,
  avg_7d,
  ROUND((row_count / avg_7d) * 100, 1) AS pct_of_average
FROM daily_counts, avg_count
WHERE date = CURRENT_DATE()
  AND row_count < avg_7d * 0.7;
Distribution
Revenue shouldn’t be null or negative. This query checks for both across today’s orders:
SELECT
  COUNT(*) AS total_rows,
  SUM(CASE WHEN revenue IS NULL THEN 1 ELSE 0 END) AS null_revenue,
  SUM(CASE WHEN revenue < 0 THEN 1 ELSE 0 END) AS negative_revenue
FROM orders
WHERE DATE(created_at) = CURRENT_DATE();
If null_revenue or negative_revenue is above zero, you have a distribution problem worth investigating.
Challenge yourself!
You have seen the pattern across the first three pillars. Now, using the same orders table, can you:
Write a Python script that detects schema changes and alerts you when a column is added or removed?
Create a dbt model that tracks lineage from
orders_dailytorevenue_dashboard?
Drop your answers in the comments.
So, what does data observability change for your team?
Benefits of data observability
The most obvious benefit is catching problems before your stakeholders do. But the impact goes further.
Reduced data downtime
Data engineers spend a significant chunk of their time hunting down bad data. Observability shortens that from days to minutes, freeing your team to build instead of debugging.
Build stakeholder confidence in your data
When a dashboard shows a number that doesn’t match another, trust in the data team erodes. Observability means you catch discrepancies before they reach a boardroom.
Faster root cause analysis
Instead of digging through logs manually, observability surfaces the source of the issue directly. You go from “something is wrong” to “here is what broke” in a fraction of the time.
From reactive to proactive
When people trust the data, they use it more. Teams stop second-guessing numbers, analysts drop the manual checks, and leadership decides with confidence.
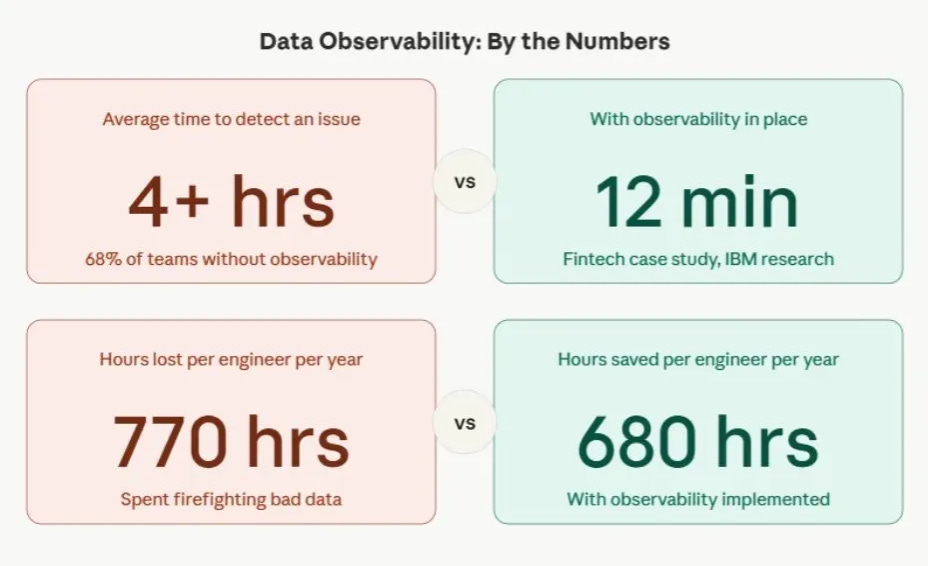
But don’t just take our word for it! Here’s who is already using data observability at scale.
Who is already using data observability
Data observability is not just for large tech companies, but some of the biggest names in the industry got there early.
Airbnb built an internal data observability tool called Minerva to ensure the accuracy and consistency of their metrics across the organization. It automated their data quality monitoring process, which reduced the manual effort associated with data quality checks.
BlaBlaCar, the world’s leading community-based travel network, reduced its time to resolution by 50% after implementing data observability. What previously took 200 hours of investigating root causes was simply cut in half.
Contentsquare saw a 17% reduction in time to detection within the first month of deploying data observability, even though they had already invested heavily in data testing.
Resident, an online home goods retailer managing over 30,000 data tables, reduced their overall number of data incidents by 90% after implementing automated freshness alerts and lineage tracking.
The pattern across all of these is the same. Teams that invested in observability stopped being reactive and started catching problems before anyone else noticed.
Further reading: If this got you curious, our book, Data Observability for Data Engineering: Proactive strategies for ensuring data accuracy and addressing broken data pipelines goes much deeper on everything we covered here and more.
So, the results are clear. The next question is: which tools actually help you get there?
Data observatory tools
The tools mentioned here automate everything we just coded, so you dont have to it manually!
Open-source tools
Elementary is built on top of dbt, making it a natural fit if your team already uses dbt for transformations. It automatically handles the freshness, volume, and distribution checks we wrote above with minimal setup overhead.
OpenTelemetry is more flexible but requires more configuration. It is better suited for teams that want deeper, customized visibility across their pipelines.
Commercial tools
Monte Carlo is the most established player. It covers all five pillars out of the box, offers end-to-end lineage, and integrates with most modern data stacks. Built for teams that are serious about data reliability at scale.
Bigeye focuses heavily on data quality monitoring, letting you set thresholds and rules, giving you finer control over what you monitor.
Anomalo uses machine learning to learn what normal looks like for your data and flags deviations automatically. Great for teams with a lot of tables and not the time to configure rules for each one.
When the cost of bad data exceeds the cost of the tool, a commercial platform pays for itself quickly. If you are a small team, start with open-source and revist when you outgrow it.
Which pillar should you tackle first?
Starting from scratch does not mean starting everywhere at once. Pick the pillar that matches your biggest pain right now:
Start with freshness if your stakeholders keep asking “is this data up to date?”
Start with volume if your pipelines pull from external sources or third-party APIs.
Start with schema if your source systems change frequently, or multiple teams write to the same tables.
Start with distribution once the basics are covered.
Tackle lineage last, not because it is unimportant, but because it requires the most investment to set up properly.
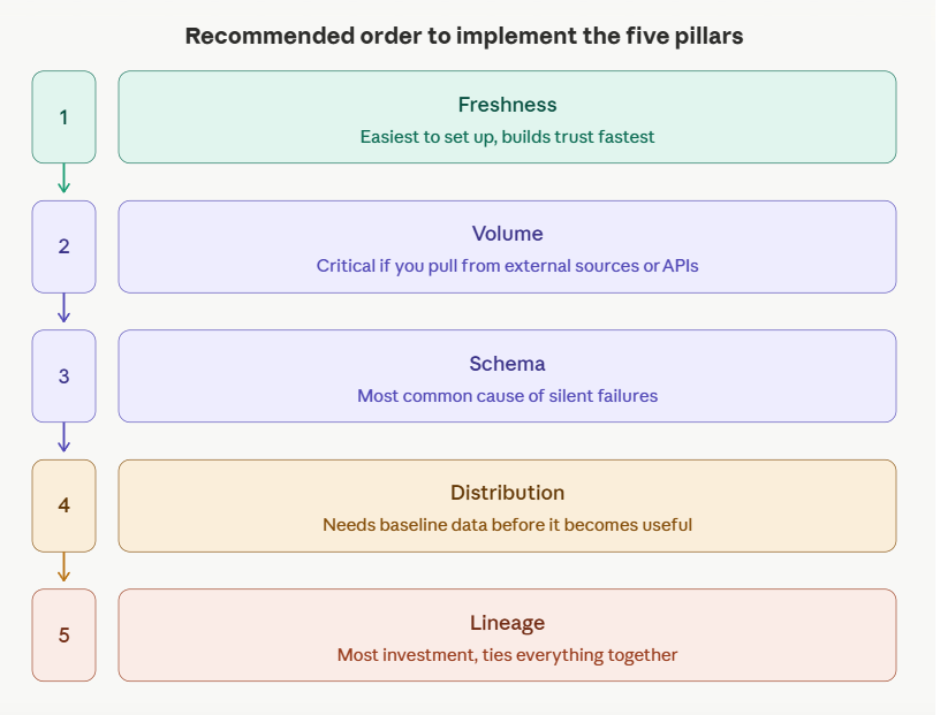
A simple rule of thumb: Look at where your last three data incidents came from. Start there.
So, the next time your pipeline runs clean but something feels off, you know where to look!
In part 2 of this article, we will cover the code for pillars 4 and 5 and do a thorough understanding of the Microsoft Osmos case study. Stay tuned!
Really appreciate you pushing data observability, but this framing (5 pillars: freshness, volume, distribution, schema, lineage) and even a lot of the wording comes directly from Barr Moses / Monte Carlo’s original work on “the five pillars of data observability.”
For folks who want the source material, here’s the original post from 2020: https://www.montecarlodata.com/blog-introducing-the-5-pillars-of-data-observability/